We understand that some businesses need to delve deeper, discover more insights, and produce more detailed, in-depth reports. Zonal offers a range of additional EPoS reporting tools that go above and beyond the standard reporting functions that come with your EPoS system.
Dimensions+
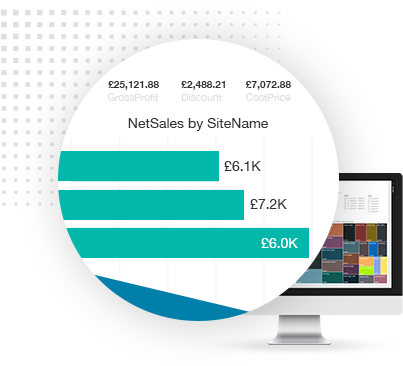
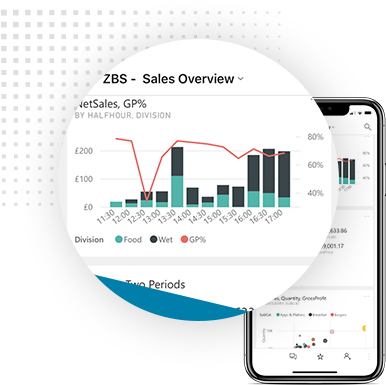
With Dimensions+, view all aspects of your EPoS data, track KPIs, make year on year comparisons and map across your different brands in one simple easy to read dashboard. In addition to same day activation, Dimensions+ can also pull through data history, offering meaningful insights, trends and reporting from day one.
Using Microsoft Power BI, Dimensions+ aggregates data from EPoS together with external sources such as Payroll systems and budgets, to get a detailed picture of your entire estate in one single view. By visualising data in easy-to-understand graphics, operators can quickly identify trends and areas that require immediate attention.


With Dimensions+ view all aspects of your EPoS data, track KPIs, compare year on year and map across your different brands in one simple, easy-to-read dashboard. In addition to same day activation, Dimensions+ can also pull through data history, offering meaningful insights, trends and reporting from day one.
- View and analyse your business data in one single view
- Real-time data analysis and comprehensive reporting
- Easy-to-understand business intelligence dashboards
- One version of the truth, not numerous disparate reports
- Accessible on PC, tablet or mobile
Dimensions Publisher
Reports are produced for a reason. Data is only valuable when it’s put in the right format and delivered to the right people. Which is why how and when you publish your reports is as important as the data itself. Dimensions Publisher is an intuitive tool that puts in you in charge of the distribution list for every report you produce.
- A complementary product to Dimensions+
- Control the precise day and time reports are published
- Control exactly where reports are distributed to
- Set up and manage distribution lists
- Publish custom and standard reports as desired

Adding real value to your business
Zonal’s solutions are purpose-built for the hospitality industry, benefiting small independents and large chains alike.

“The reporting has given our managers a level of accountability and responsibility they didn’t have previously, and they have responded well to the opportunity and insight they now have at their fingertips.”

Dimensions is extremely intuitive and mines data quickly, so that we have more time to focus on our business. The old age ‘a picture speaks a thousand words’ relates to Dimensions+ as it does the same thing for spreadsheets, transforming data into a graphic, which is great to share with employees. It’s a game changer!”

“We wanted to increase the value of the information we receive from our managed pubs, so that we always had a clear picture of our performance and could identify areas of success or improvement quickly and accurately.”


